English translation
I Tested a Chinese AI Agent: In 20 Minutes It Produced Word, PPT, Charts, and a Full Report
Hi, I am Guozhen.
In the past, if I needed to read several PDF reports, summarize them into a Word document, create a few charts, and then turn everything into a PPT, the whole process still required a lot of manual adjustment even with AI.
Recently I gave this task to Tiangong. I only typed one instruction in one chat box.
This article is my hands-on test.
1. Result demo
Before this, researching two papers usually meant this workflow:
Read papers -> take notes -> write a Word report -> painfully make a PPT -> manually draw comparison tables.
At least half a day would disappear.
With the right AI tool, the situation is different.
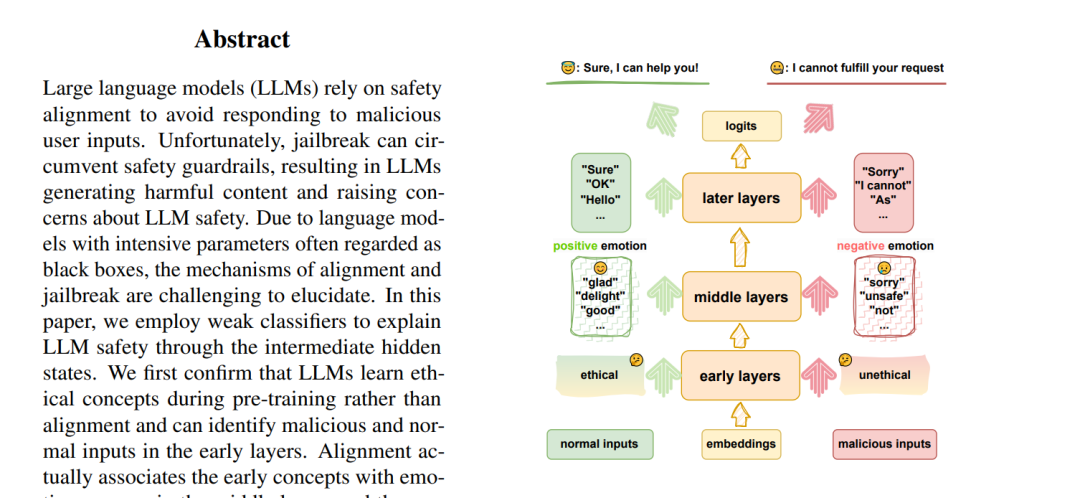
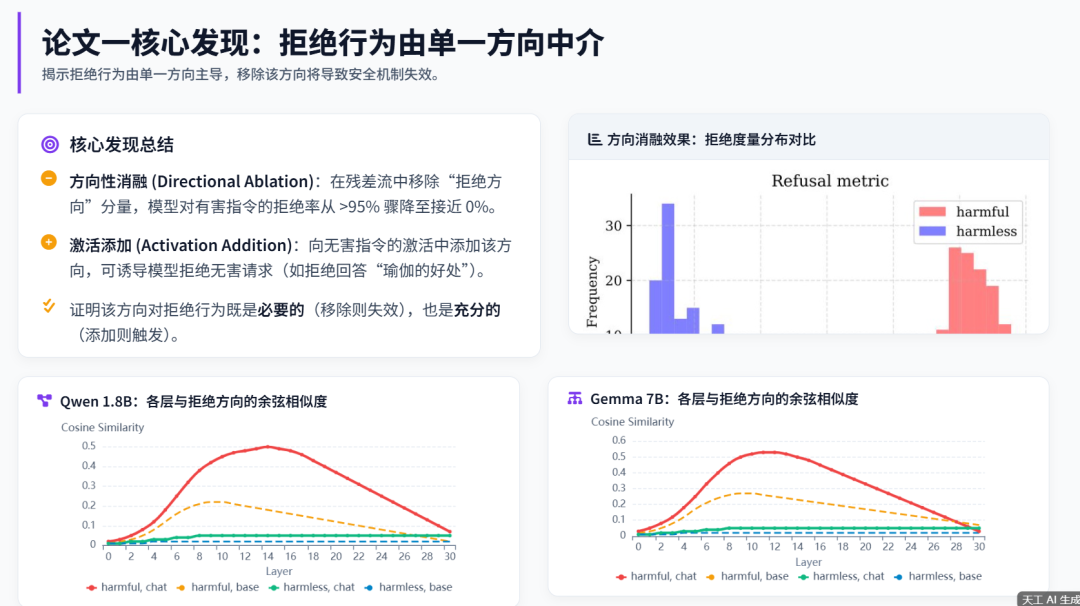
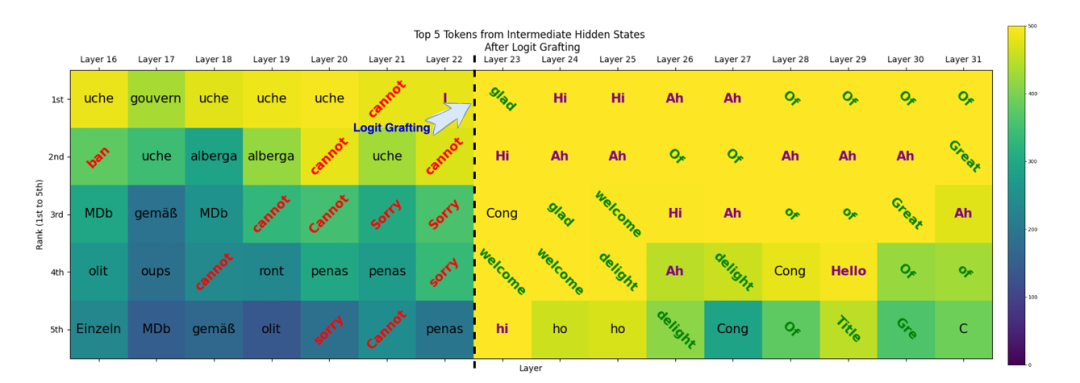
These are the two papers I used today. Here is a screenshot from the first page of one paper:
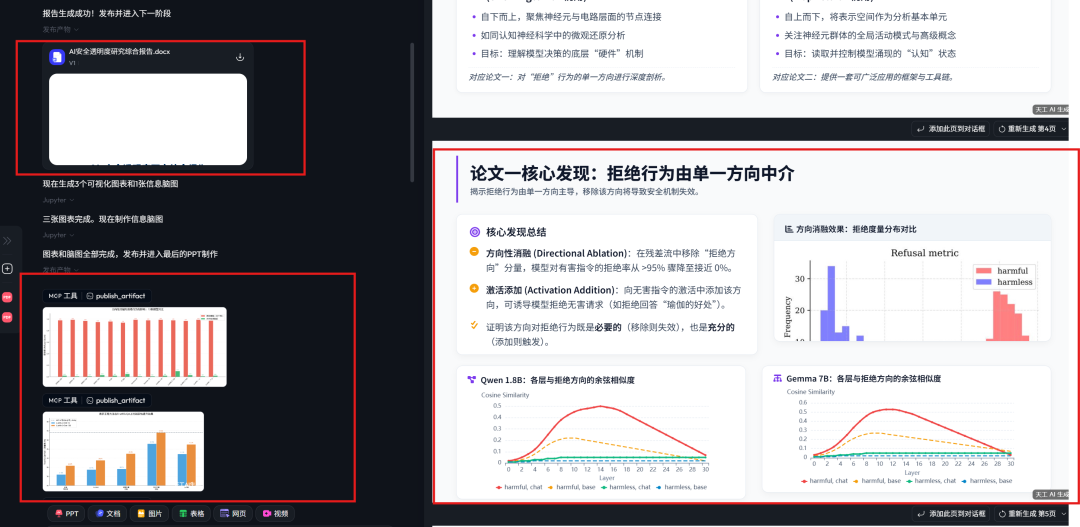
I fed the papers into Tiangong AI. It kept running in the background, and after roughly 20 minutes, it produced a whole chain of outputs at once:
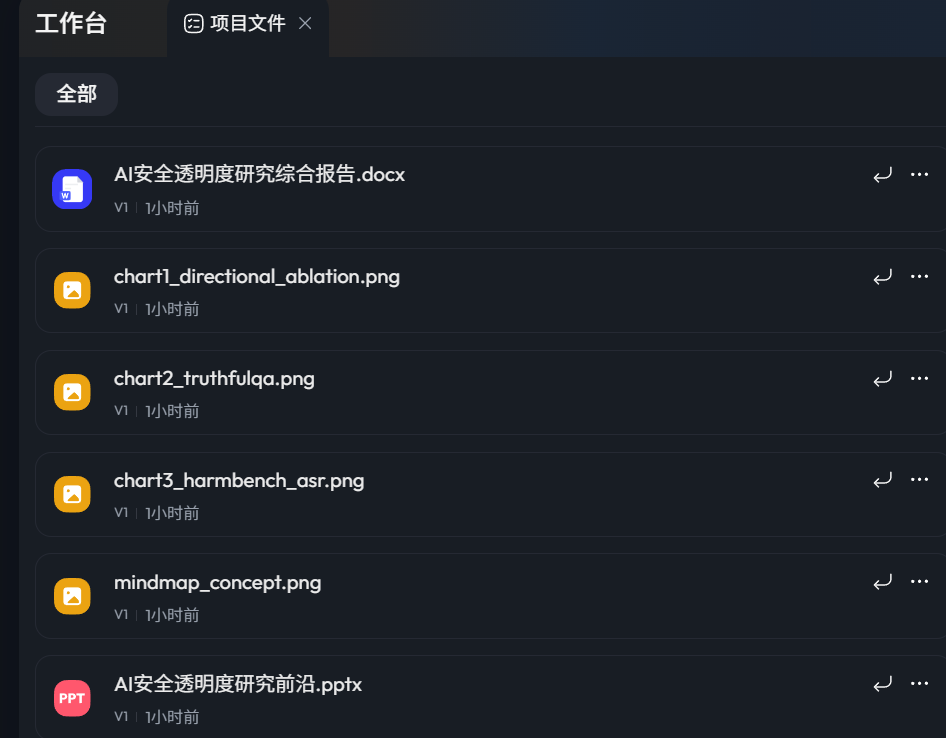
In one run, Tiangong generated the following deliverables from the two papers I uploaded:
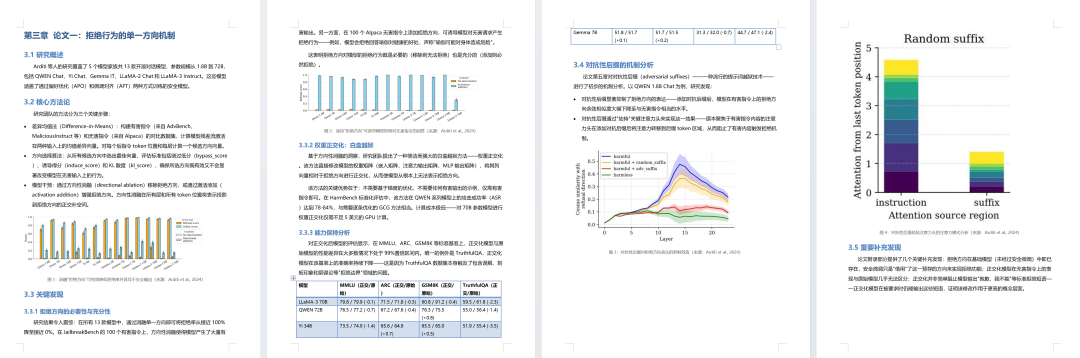
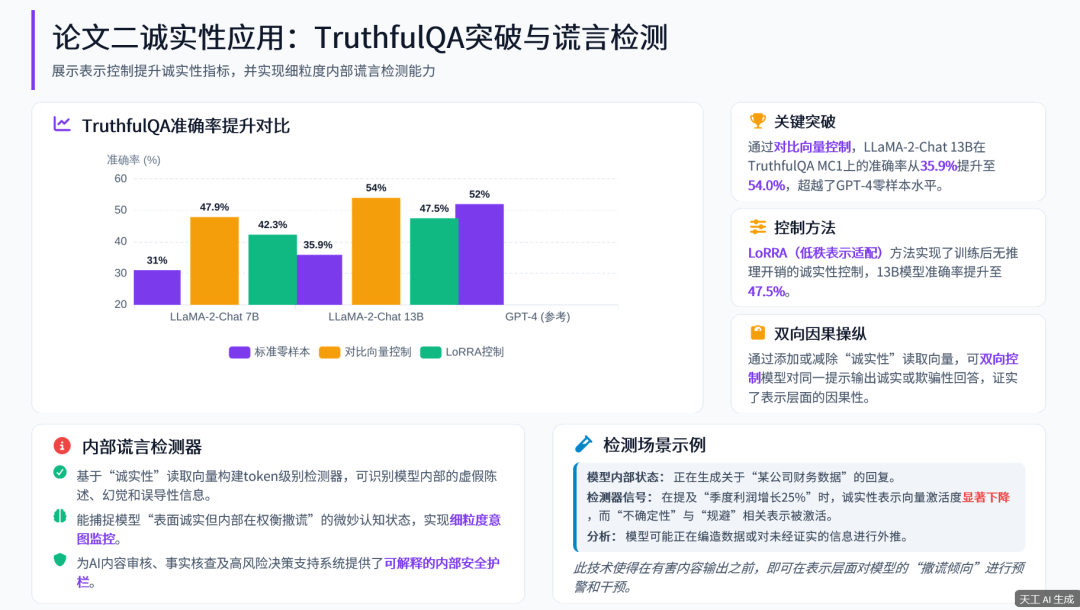
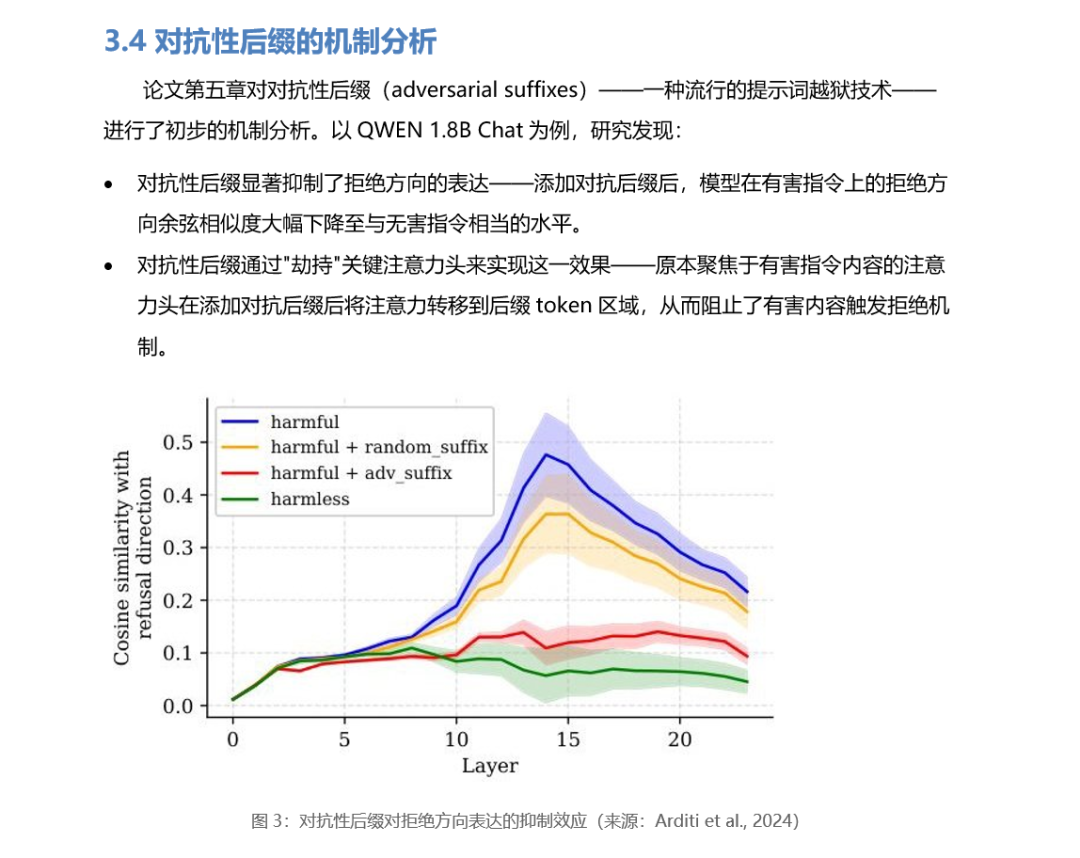
The Word summary document had 17 pages. It included conclusions from the papers, and after understanding the content, the AI generated matching data charts:
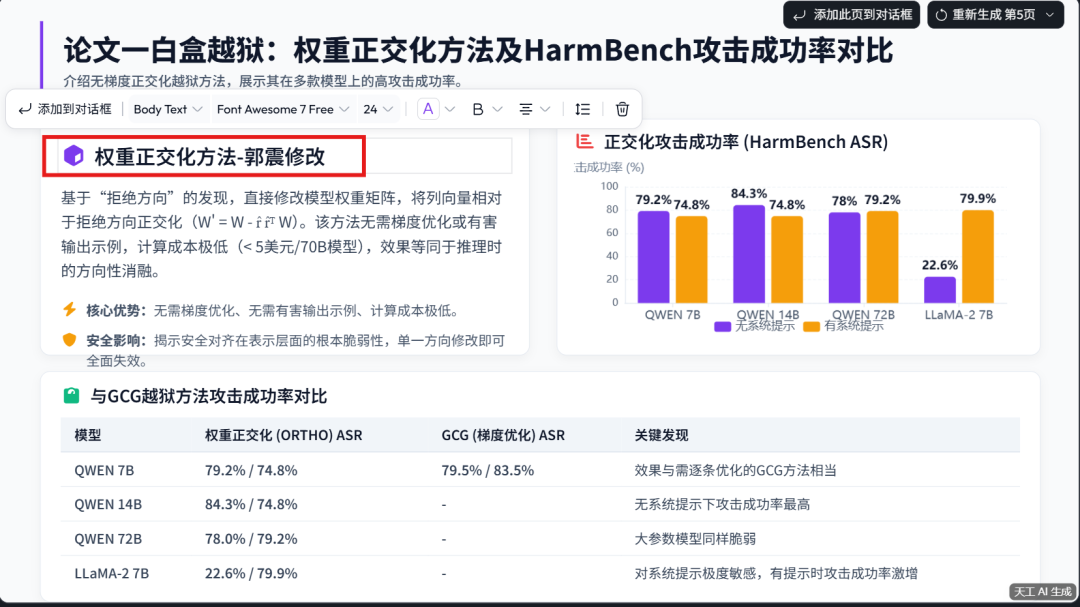
The full PPT had 10 pages. The structure, visuals, charts, and citations were planned by the system itself:
Tiangong also created a professional-looking visual data table based on the paper content:
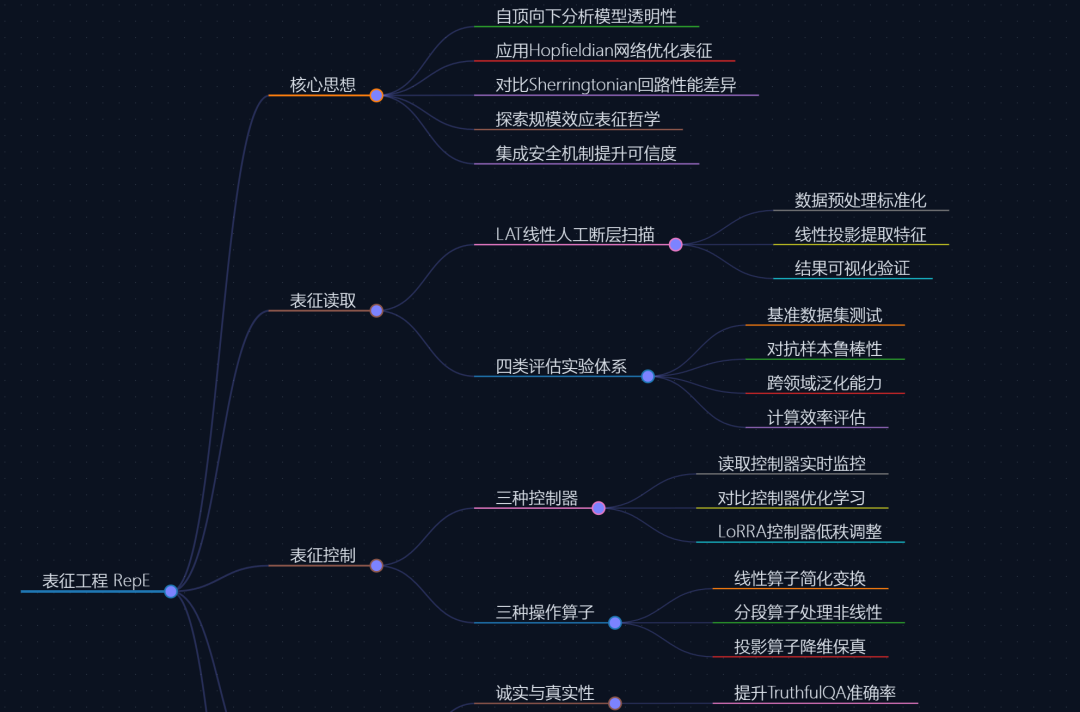
More screenshots, including the mind map, appear in the next section. Getting all of this in about 20 minutes was honestly exciting.
The tool I used for this chain of outputs was Tiangong Super Agent.
2. Tiangong
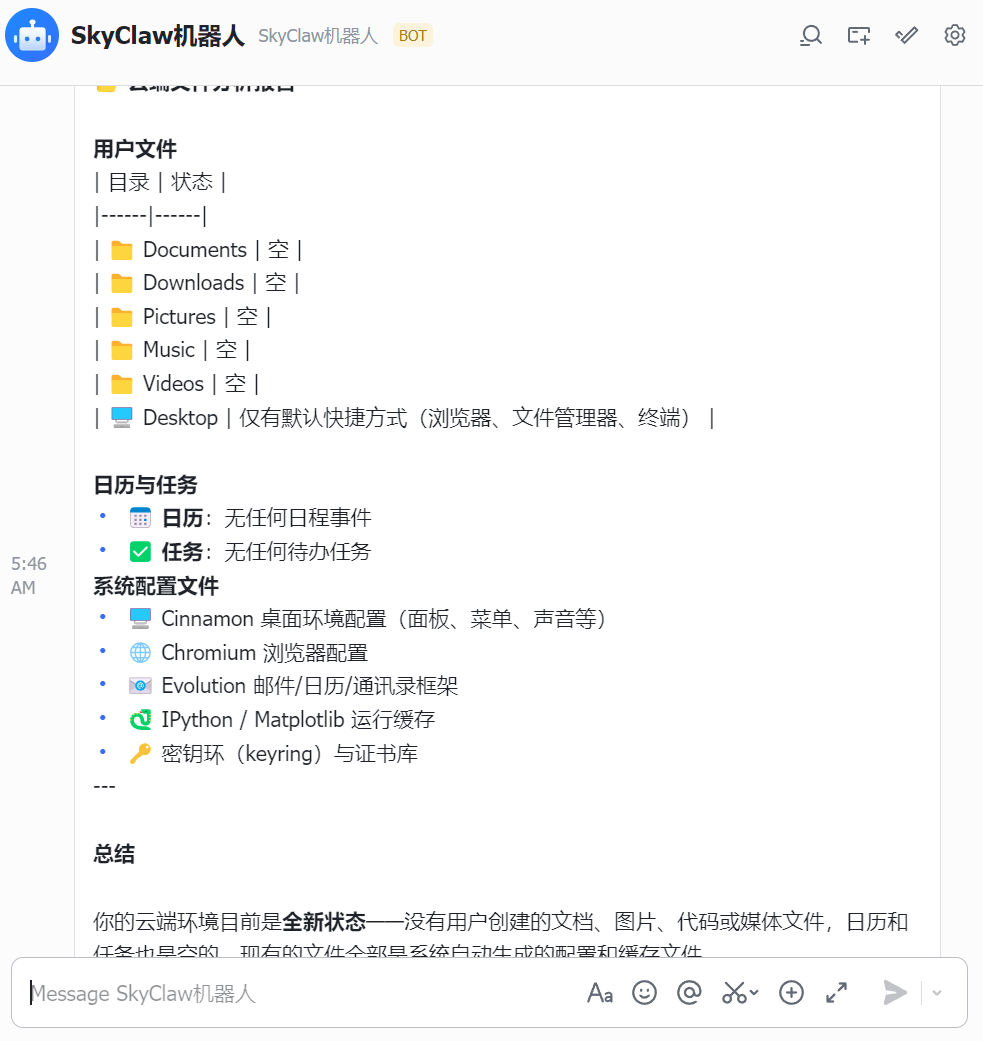
There is no need to set up a local Python environment. Tiangong includes a cloud virtual machine:

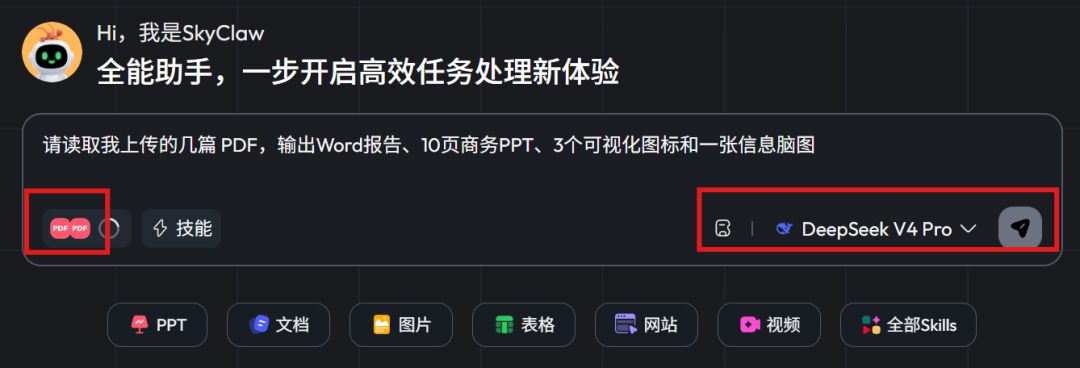
Now we can give instructions to it like a manager assigning work:
Please read the PDF files I uploaded and output a Word report, a 10-page business PPT, three visualization charts, and one information mind map.
I selected DeepSeek V4 Pro as the large model. Tiangong also includes flagship models such as Qwen, Kimi-2.6, and GLM, which can be selected as needed:
When the task starts, it does not simply reply with a few sentences. It breaks the work into multiple subtasks:
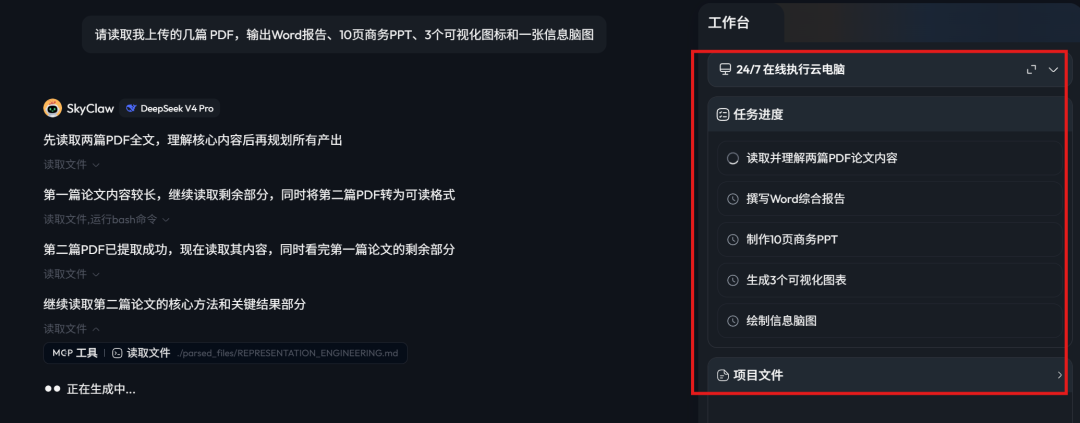
It has six built-in expert productivity skills: documents, PPT, images, spreadsheets, web pages, and video.
Instead of jumping between five different tools, it outputs the kind of result shown at the start of this article in one run.
Generating page 8 of the PPT:
Generating the Word document:
Part of the mind map:
Tiangong also includes a multimodal editor inside the agent workspace. All AI-generated outputs can be edited online, either by AI or manually. In the screenshot below, I directly edited the title of page 5 of the generated PPT:
It can also be controlled from a phone through Feishu:
You can send a task to Tiangong directly inside Feishu, let it analyze files and organize the report in the cloud, then receive the result back there.
3. SkyClaw-v1.0
Besides the web-based agent product, Tiangong also released its high-performance agent model: SkyClaw V1.0, a self-developed model with million-token context and very low cost.
Right now, there are not many models deeply optimized for agent environments such as OpenClaw and Nanobot.
In testing, SkyClaw gets close to Claude Opus 4.6 and DeepSeek V4 Pro:
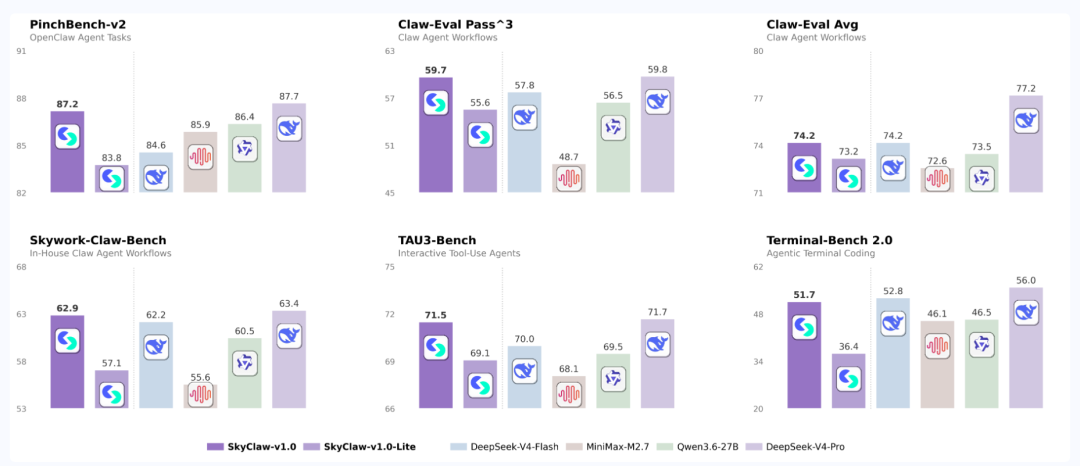
Tiangong also launched SkyClaw-v1.0-lite, which is faster and cheaper.
So how does it perform in a real production task? I tested it next.
I connected SkyClaw-v1 to Claude Code:
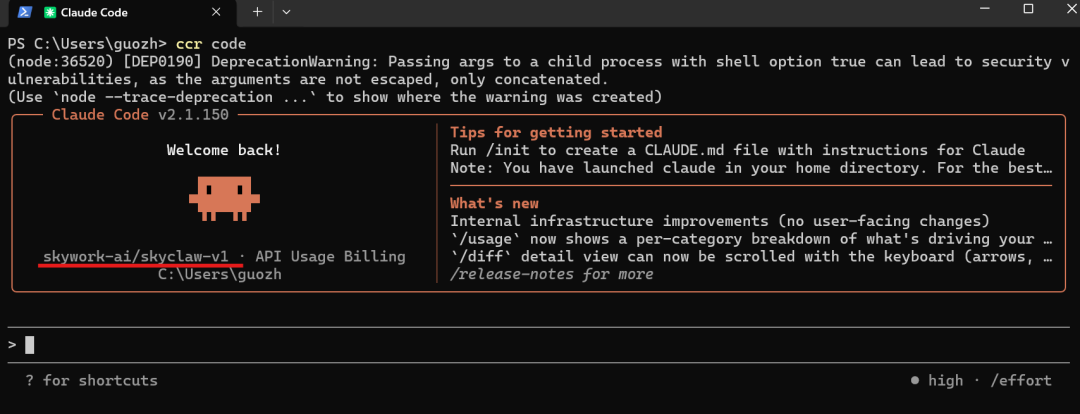
Then I gave it one of my usual agent tasks to see whether it could go from reading requirements all the way to delivering a runnable web page:
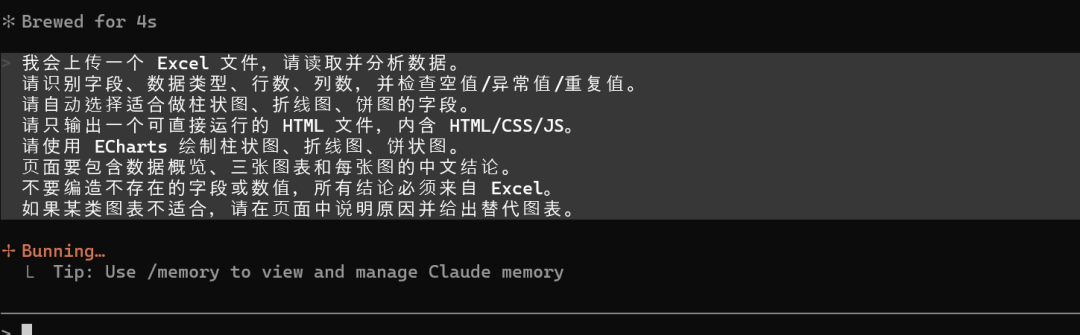
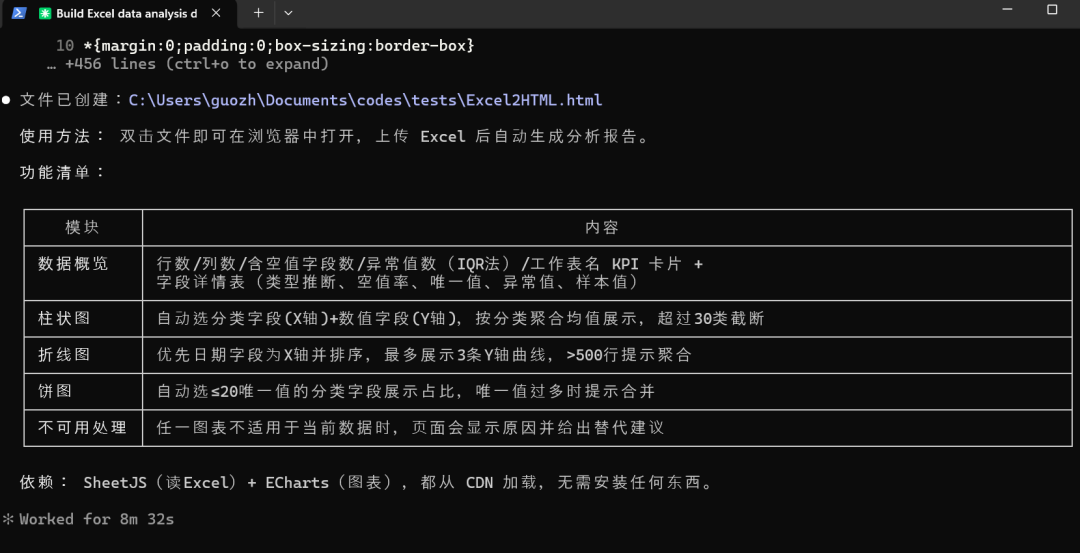
I will upload an Excel file. Please read and analyze the data. Identify fields, data types, row count, column count, and check empty values, outliers, and duplicates.
Automatically choose fields suitable for bar charts, line charts, and pie charts.
Only output one directly runnable HTML file containing HTML/CSS/JS.
Use ECharts to draw a bar chart, line chart, and pie chart.
The page should include a data overview, three charts, and a Chinese conclusion for each chart.
Do not invent fields or values that do not exist. All conclusions must come from the Excel file.
If a chart type is not suitable, explain why on the page and provide an alternative chart.
This task is demanding. The model has to coordinate file reading, code writing, chart selection, and HTML delivery. If it cuts corners at any step, the final result breaks.
During local development, SkyClaw decomposed the requirements and created the project structure by itself:
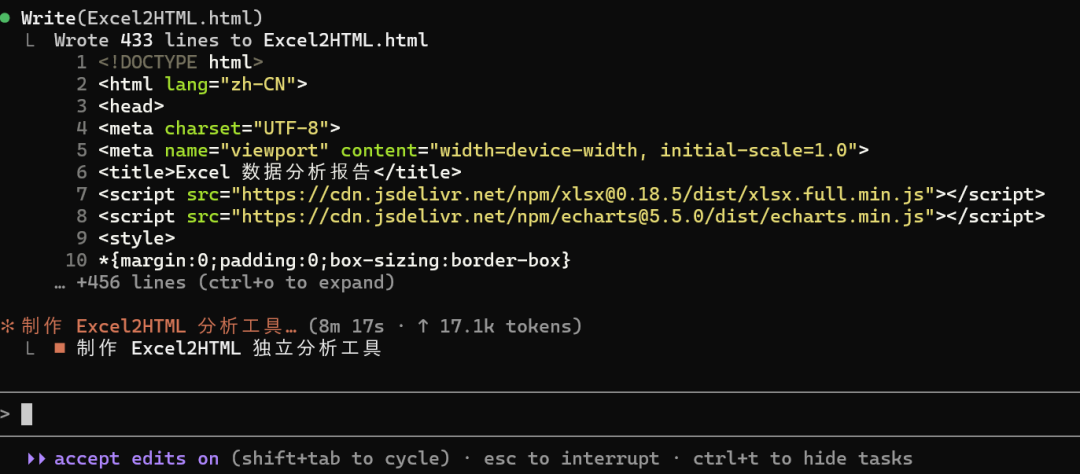
Development completed:
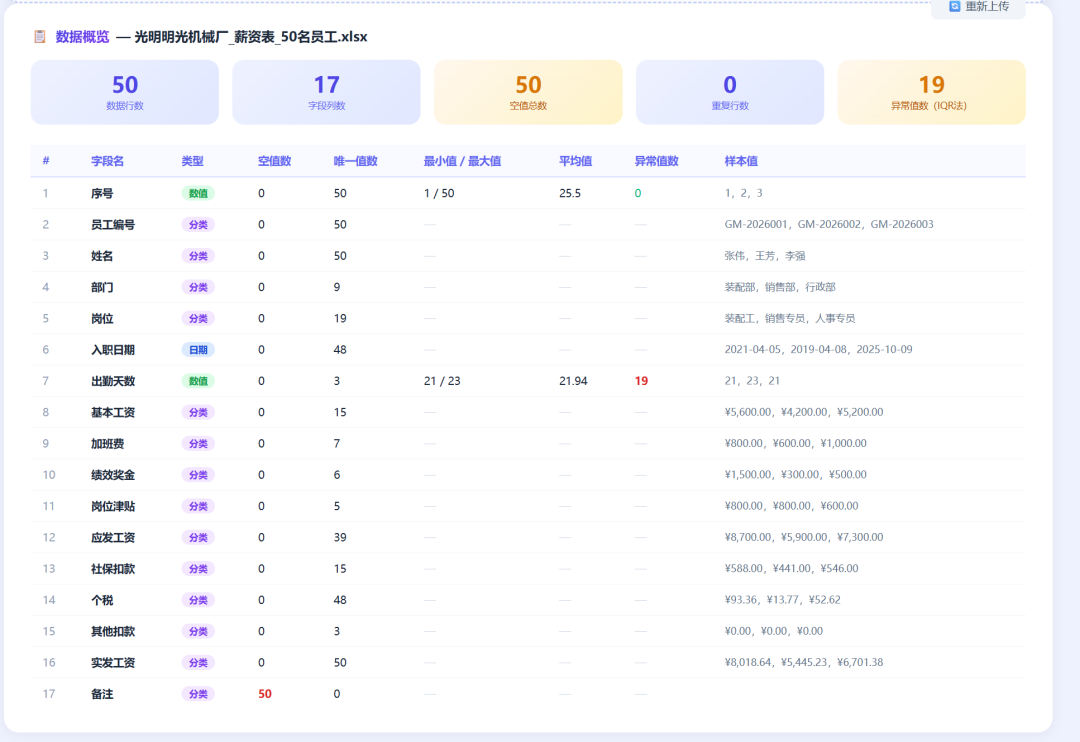
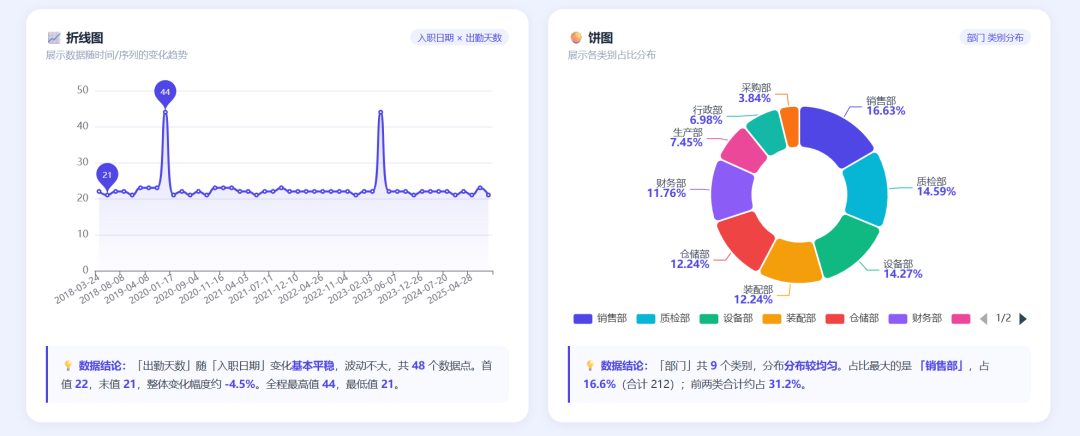
After uploading an Excel file, the result appeared in the web page. The data overview, three charts, and Chinese conclusions for each chart all appeared as requested. Field-type detection and empty-value checks were not missed:
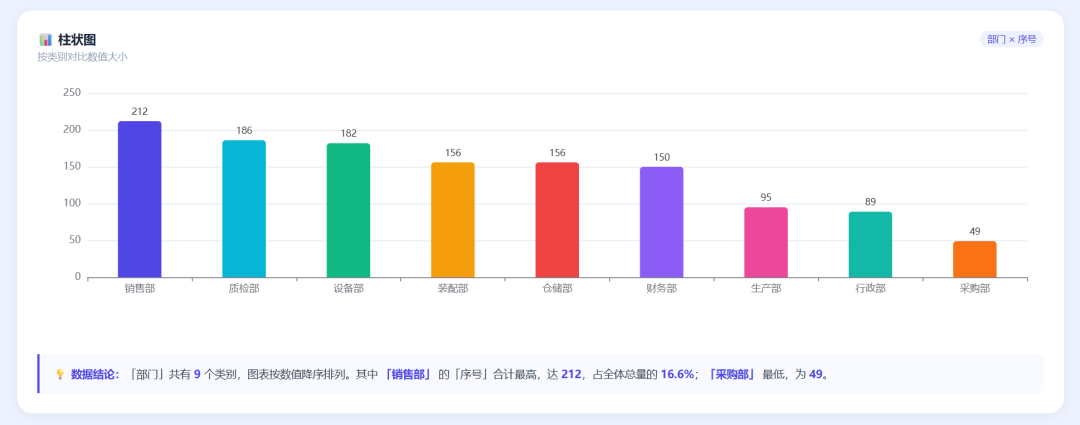
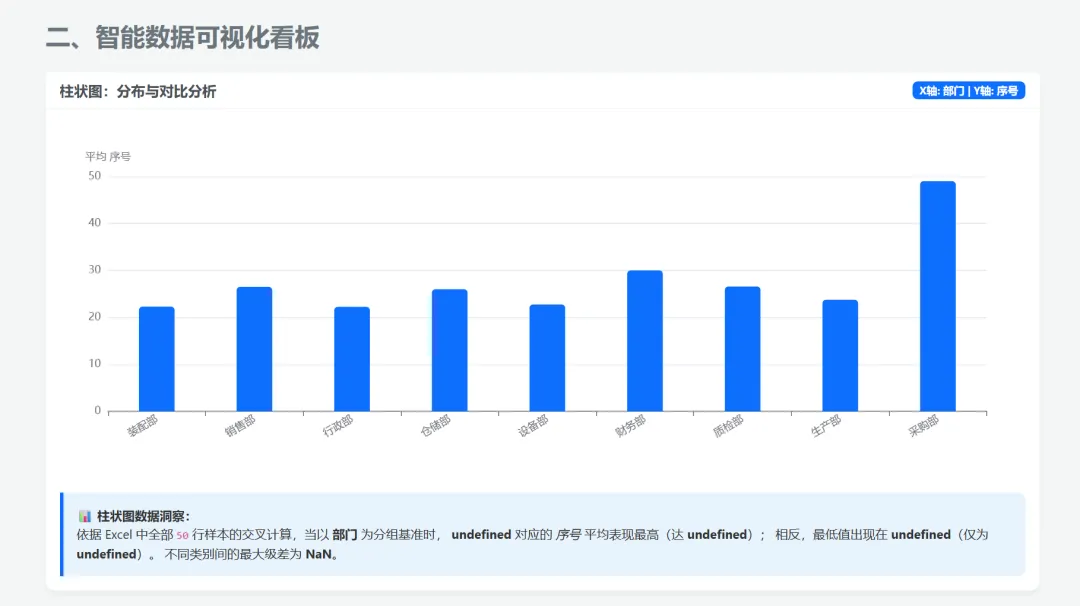
Bar chart:
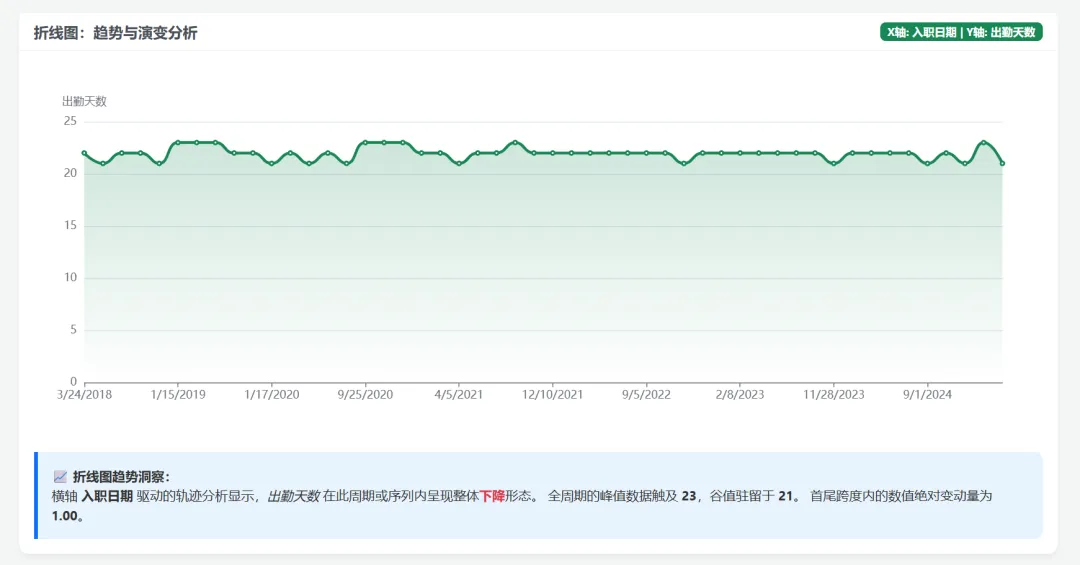
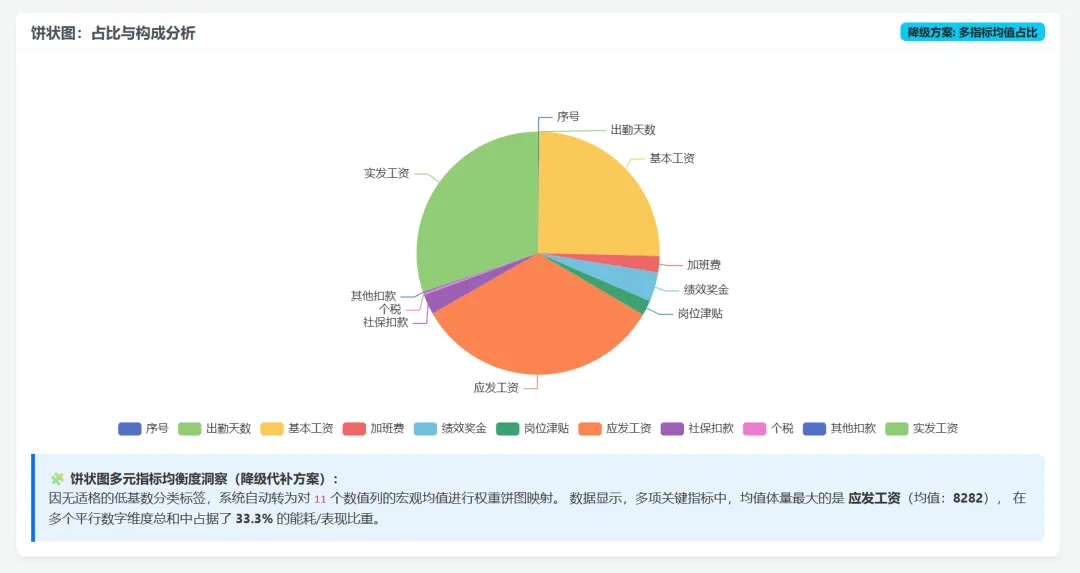
Line chart and pie chart:
I sent the same task to the latest Gemini-3.5-Flash model.
Result display:
Visually, SkyClaw's result is not weaker than Gemini-3.5-Flash. But the important difference is that overseas models are usually more expensive.
Starting today, both SkyClaw v1.0 and its Lite model can be requested through the apifree.ai entry point for free trial access. You only need an API Free account and a free API key:
Final thoughts
This article tested Tiangong Super Agent and Tiangong's self-developed SkyClaw v1.0 model. Based on the results, it feels like a small cloud team.
I only state the goal. It breaks down the task, runs the workflow, generates documents, makes the PPT, and organizes charts.
For individual creators, students, and researchers, this feels more like a 24/7 cloud AI team than a single chatbot.
I previously tested GPT-5.5 on generating a mind map from two papers. The result looked like this:
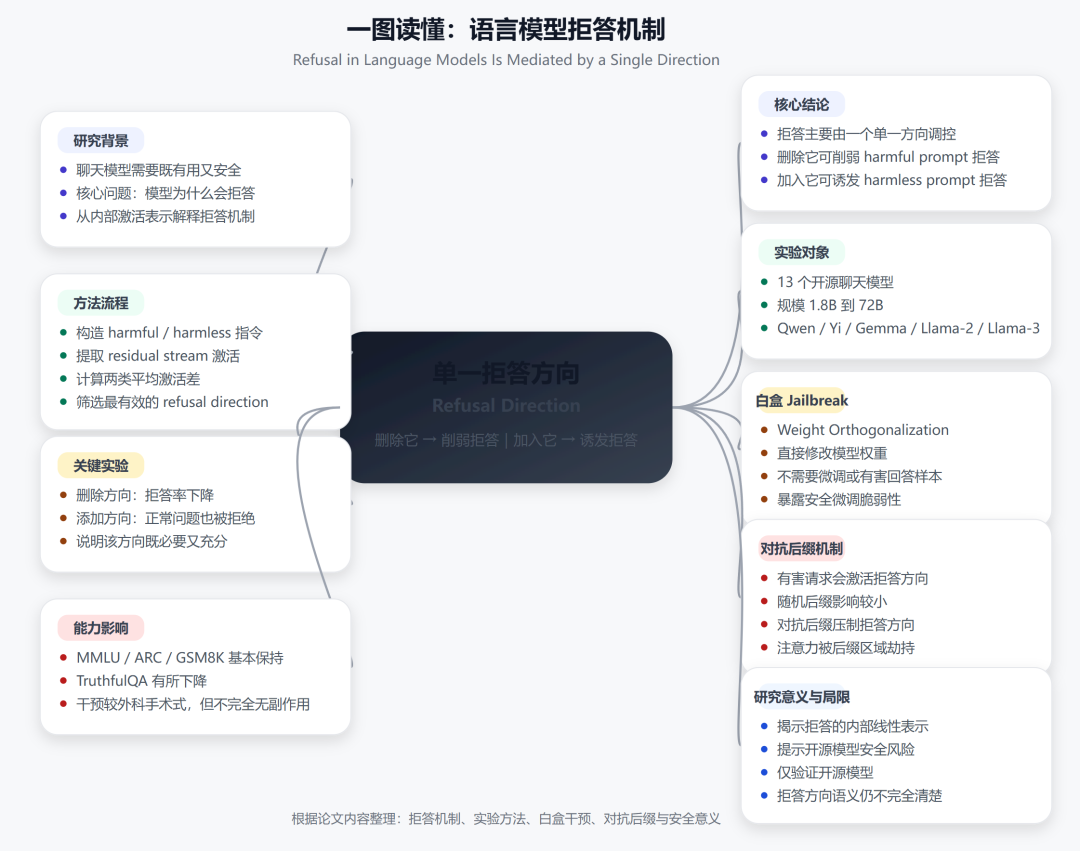
It works, but it is not beautiful enough. Producing a stable chain of multimodal outputs is not easy.
Now there are AI tools such as Tiangong that can actually do it. If you have been looking for this kind of AI tool and have not found a good one yet, it is worth trying.
This English edition preserves the screenshots and workflow order from the original Chinese article.